



By Ewen Ling, Co-Founder, Referwo | Ecommerce Growth Strategist
Last updated: August 2026
A good return on ad spend (ROAS) for influencer marketing is generally 3:1 or higher, meaning three dollars back for every dollar spent. That is a useful floor, not a target. The number you should actually expect depends on three things: your vertical, whether creators are paid or gifted, and how you track attribution.
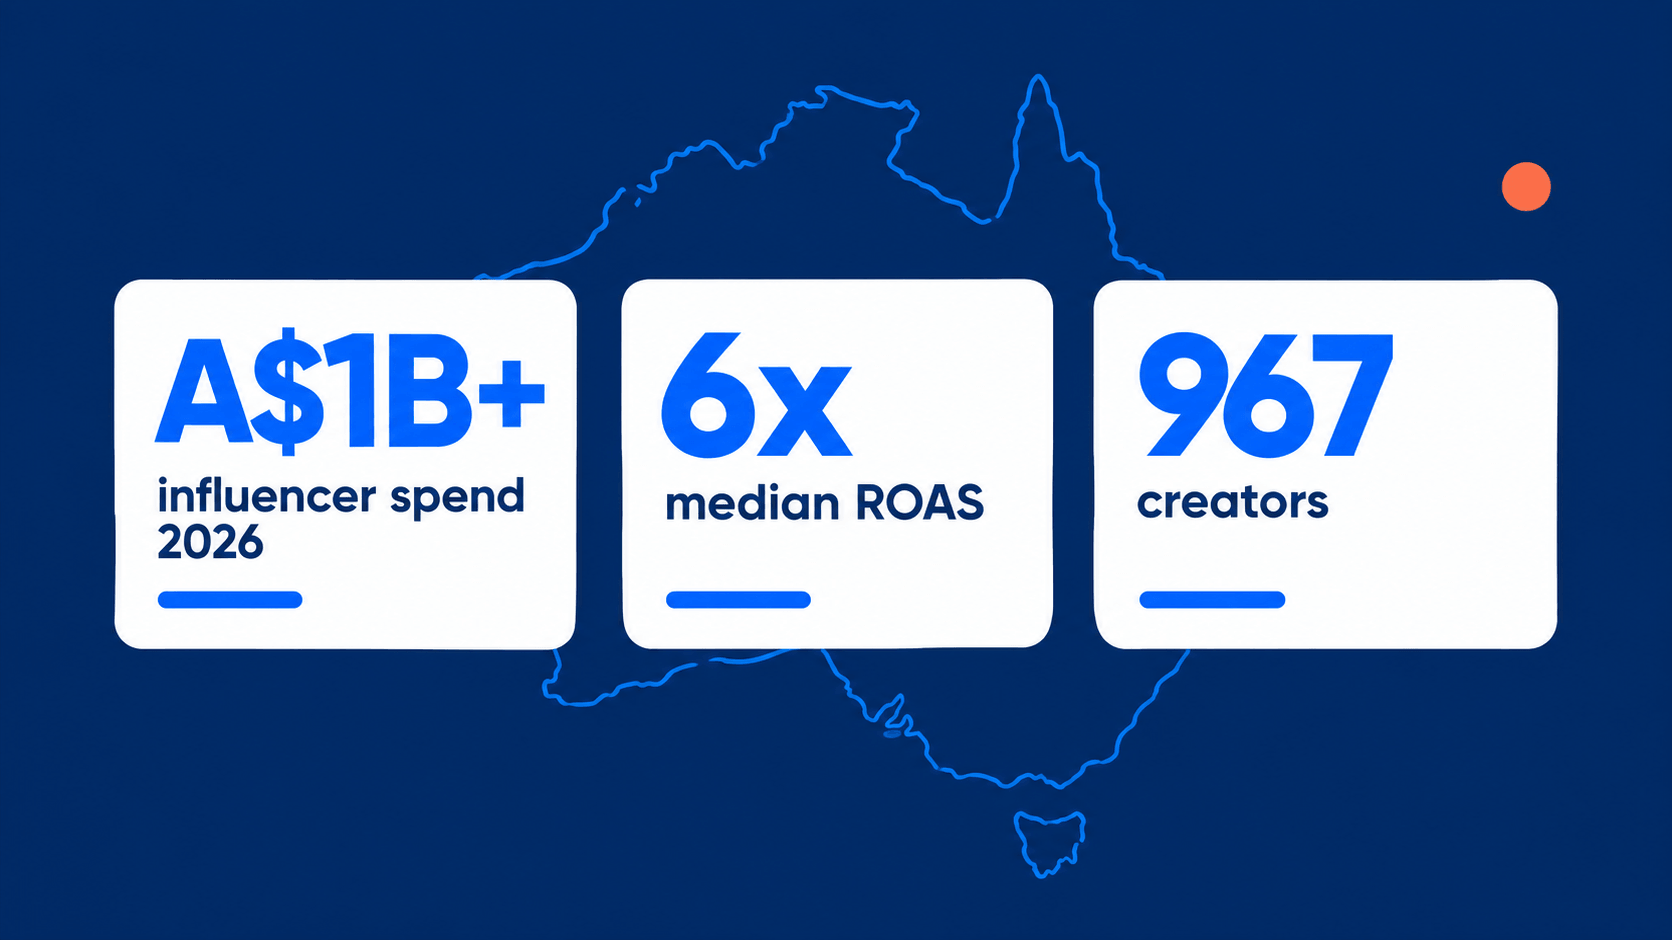
As a working range, a first influencer campaign returning 2:1 to 3:1 is a realistic result, and optimised programs often reach 4:1 to 6:1 over time, according to the Influencer Marketing Hub Benchmark Report. Broader industry figures that include earned media value sit higher, around 5:1 on average, because they count reach and content value, not only tracked sales.
Treat every published benchmark as a rough guide, not a verdict on your campaign. The only ROAS that describes your brand is the one you measure yourself, with consistent tracking. This guide explains the ranges, why they move so much, and how to read your own number honestly.
Quick answer
A good ROAS for influencer marketing is typically around 3:1 or higher, though this varies by vertical, whether creators are paid or gifted, and how attribution is tracked. Paid campaigns are usually judged on direct short-term return, while gifted campaigns often deliver lower measured ROAS but cheaper reach and content. Brands should track their own ROAS consistently using discount codes or UTM links rather than relying on general benchmarks alone.
What counts as a good ROAS, in short
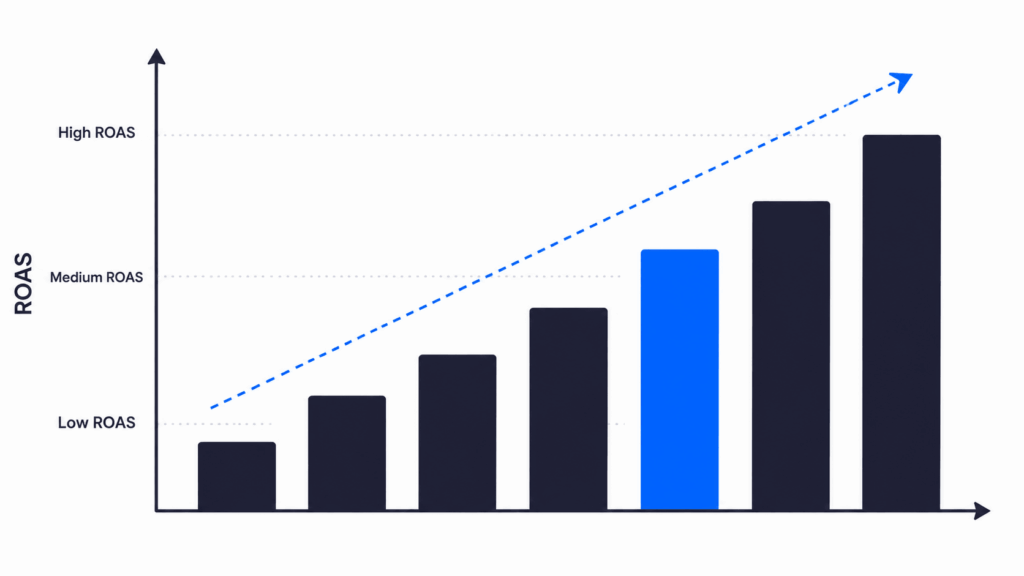
A good ROAS is one that clears your break-even point with margin to spare. For most ecommerce brands that lands near 3:1, but the honest answer is that a good ROAS is relative to your product margin. A brand with a 70% margin can profit at a lower ROAS than a brand running on 25%.
Return on ad spend (ROAS): The revenue attributed to a campaign divided by the amount spent on it. A 4:1 ROAS means the campaign returned four dollars in revenue for every one dollar spent.
Here is the part most benchmark articles skip. ROAS is revenue divided by spend, before costs. Your break-even ROAS is set by your gross margin. Work out your own floor before you judge any campaign against a published number.
- A 25% gross margin needs roughly a 4:1 ROAS to break even before overheads.
- A 50% gross margin breaks even near 2:1.
- A 70% gross margin can break even close to 1.5:1.
So a 3:1 ROAS is a strong result for a low-margin brand and a mediocre one for a high-margin brand. The benchmark that matters is your own break-even, not an industry average. Everything below explains why the averages swing so widely and how to read your figure in context.
Keep one distinction clear: ROAS is not profit. ROAS measures revenue against ad spend, but it ignores product cost, shipping, transaction fees, and returns. Two campaigns with an identical 4:1 ROAS can have very different profit outcomes once those costs land. Use ROAS to compare campaigns against each other, and use your margin to decide whether any of them actually made money.
What the published benchmarks actually say
Published influencer benchmarks cluster around a 5:1 average, but they disagree on the exact figure because they measure different things. Some count only tracked sales. Others include earned media value, which inflates the number. Knowing which is which stops you from comparing your sales-only ROAS to an average that was never sales-only.
The most-cited figure is around 5:1 across all industries and creator tiers, drawn from the Influencer Marketing Hub Benchmark Report and repeated across most 2026 trackers. Top-performing programs report far higher, often in the 10:1 to 20:1 range, while underperforming campaigns can return under 3:1. That spread is the real headline: the average hides enormous variance.
Earned media value (EMV): An estimate of what a creator’s organic reach and engagement would have cost as paid media. EMV inflates a ROI figure above pure sales ROAS, so a benchmark that includes EMV is not directly comparable to a sales-only number.
This is why a brand tracking only discount-code sales can feel like it is underperforming against a 5:1 benchmark, when in reality it is comparing a strict sales figure to a blended one. Match the benchmark to your measurement before you draw any conclusion. A sales-only ROAS of 3:1 may be outperforming a blended benchmark of 5:1.
Treat all of these as directional. Methodologies differ between trackers, sample sizes vary, and few reports isolate the Australian market. The figures are useful for setting expectations, not for grading a single campaign.
Why ROAS varies by vertical and campaign type
Return on ad spend varies because the inputs vary. Product price, repeat-purchase rate, creator tier, and campaign goal all move the number. A low-cost consumable with high repeat purchase can post a very different ROAS to a one-off high-ticket item, even with identical creators. Compare like with like, or the comparison is meaningless.
Vertical is the first driver. Beauty, food, and fashion tend to convert well through creators because the products are visual, affordable, and impulse-friendly. Considered purchases, like furniture or high-ticket electronics, convert more slowly, so a single-campaign ROAS understates their true contribution.
Creator tier is the second driver. Micro creators, those with 10,000 to 100,000 followers, tend to have far higher engagement than mega creators. Industry data for 2026 puts micro-influencer engagement near 3.86%, against roughly 1.21% for the largest accounts. Higher engagement at a lower rate is why micro creators often produce a stronger ROAS per dollar for a small brand.
Campaign goal is the third driver. A campaign built to drive immediate sales through a discount code will show a higher measured ROAS than one built to seed content and awareness. Neither is wrong. They are answering different questions, which is exactly why gifted and paid campaigns need different benchmarks.
Typical ROAS ranges for gifted vs paid campaigns
Gifted and paid campaigns produce different ROAS profiles and should be judged on different terms. Paid campaigns carry a hard cash cost, so they are measured strictly on direct return. Gifted campaigns cost only the product, so a modest number of tracked sales can produce a high ROAS, plus content you can reuse. Read them separately.

Gifted campaigns
A gifted collaboration, meaning a product gifting arrangement where creators receive product in exchange for content, has a low cash cost. Your spend is the cost of goods, not a fee. Because the denominator is small, even a handful of tracked sales can produce a high ROAS. The trade-off is volume: gifted creators are under no paid obligation, so posting and conversion are less predictable.
A quick worked example. You gift ten creators a product that costs you $25 each, so your spend is $250. Three of them post and their codes drive 40 sales at $60, which is $2,400 in revenue. That is a measured ROAS of roughly 9.6:1 on the gifted spend, plus reusable content from the creators who posted. The same $250 spent on a single flat creator fee would need those same 40 sales just to reach the same figure.
Paid campaigns
Paid campaigns pay a flat fee or a commission. A flat fee is a fixed cost regardless of results, so the ROAS depends entirely on how well the creator converts. A commission, where the creator earns a percentage of the sales they drive, ties your cost to results and protects your ROAS by design, because you only pay when a sale happens.
For a full breakdown of how the three models compare on cost and return, see our guide to gifted vs paid influencer campaigns. If you are still setting budgets, our breakdown of what influencer campaigns cost sets the spend side of the ROAS equation.
In practice, the strongest returns I see come from commission-based campaigns with micro creators. Thread the Word, an Australian brand, worked with 174 approved creators through Referwo and recorded an 8.5x ROAS across the program. Both numbers came from tracked sales, not estimates.
One caveat sits over every first-campaign ROAS: it counts the first sale only. If your product has repeat purchase, the true return on a creator-acquired customer is higher than the launch campaign shows, because it ignores every reorder that follows. A brand with strong repeat purchase can justify a lower first-campaign ROAS, because customer lifetime value carries the rest. That is a separate calculation worth running before you judge a campaign as a loss.
How attribution method changes the number
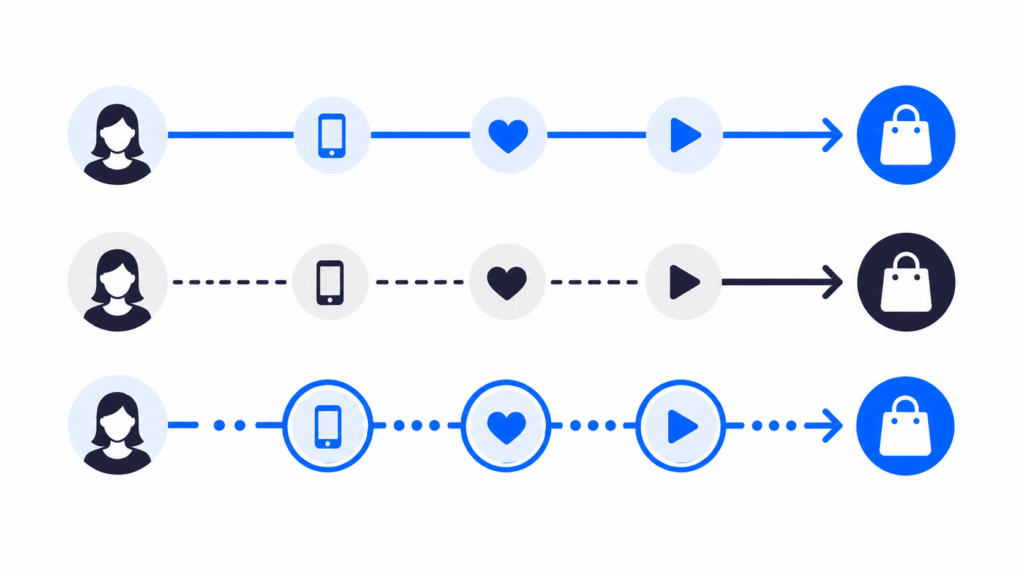
Attribution is the biggest reason two brands report wildly different ROAS from identical campaigns. Attribution is how you decide which marketing action gets credit for a sale. Change the method and the same campaign can look excellent or mediocre. Before you compare your ROAS to any benchmark, know which method produced it.
Discount codes
A unique discount code per creator is the simplest, most reliable method for a small brand. When a customer redeems the code, the sale is clearly credited to that creator. The limitation is that not every buyer uses the code, so discount-code attribution tends to undercount a creator’s true impact rather than overcount it.
Last-click attribution
Last-click attribution gives all credit to the final click before purchase, usually tracked with UTM links. UTM links are tracking tags added to a URL that show which creator’s link a customer clicked. Last-click is easy to set up, but it strips credit from creators who introduced the brand and hands it to whichever channel closed the sale, often paid search.
Multi-touch attribution
Multi-touch attribution spreads credit across every step in the buyer journey. Multi-touch attribution is more accurate for influencer marketing, because creators often sit at the top of the journey, but it needs more data and tooling than most small brands run. Most brands land on discount codes plus UTM links as a practical middle ground.
One factor sits outside all three methods: dark social. Dark social means sharing through private channels like direct messages and WhatsApp that standard analytics cannot track. A creator post shared into a group chat can drive a sale that no attribution model captures, which is another reason measured influencer ROAS usually understates the real figure. For a deeper look at getting the number right, see how to track ROI from influencer marketing.
How to improve a low ROAS
Improve a low ROAS by fixing the inputs in order: creator fit first, offer second, tracking third. A weak ROAS is usually a matching problem, not a creator-quality problem. Before you cut spend, check that you are measuring the campaign properly and pairing the right creators with the right offer.
- Check attribution first, because a low ROAS is often an undercounting problem, not a performance problem.
- Match creators to audience fit, not follower count, so the audience actually buys your product.
- Move flat-fee creators to a commission, so cost only rises when sales do.
- Give each creator a clear brief and a specific offer, so their audience has a reason to act now.
- Cut the creators who do not convert after a fair test, and reinvest in the ones who do.
One more discipline separates brands that improve their ROAS from brands that keep guessing: a fair test window. Judging a creator on 48 hours of data is a mistake. Creator content keeps converting for days or weeks through saves, shares, and reposts, so set a defined window, often two to four weeks, and measure every creator over the same period. An attribution window is the time period in which a sale is credited to a marketing action, and a window that is too short will make a good creator look like a bad one.
The single biggest lever is the switch from flat fees to commission. When creators earn a percentage of the sales they generate, your ROAS has a floor, because you are paying out of revenue that already exists. For real examples of brands that rebuilt returns this way, see our case studies on proven ROI.
This is where a platform earns its cost. Referwo tracks discount codes and affiliate links automatically, runs gifted, paid, and commission campaigns in one place, and shows creator-level ROAS in a live dashboard, so you can cut what does not work and scale what does without a spreadsheet.
Frequently asked questions
What ROAS should I expect from influencer marketing?
Expect a range, not a single figure. A first campaign returning 2:1 to 3:1 is realistic, and optimised programs often reach 4:1 to 6:1 over time, per the Influencer Marketing Hub Benchmark Report. Your own break-even depends on your gross margin, so calculate that first and treat published averages as a guide rather than a target.
Is gifted or paid influencer marketing better for ROAS?
Gifted campaigns often show a higher measured ROAS because the only cost is the product, but they deliver less predictable volume. Paid campaigns are judged on direct return and are easier to scale. A commission model gives the best of both, because you only pay when a creator drives a sale, which protects your ROAS by design.
How do I track ROAS from influencer campaigns on Shopify?
Give each creator a unique discount code, and add UTM links for click tracking. On Shopify, a platform like Referwo integrates directly, matches code redemptions and affiliate links to each creator, and shows creator-level ROAS automatically, so you do not have to reconcile spreadsheets against your orders manually.
Why is my influencer ROAS lower than my paid ads ROAS?
Usually because of attribution, not performance. Influencer content often sits early in the buyer journey and drives dark social shares, view-through visits, and branded searches that last-click tracking credits to other channels. Paid ads tend to capture that final click. Your influencer ROAS is likely higher than it looks once you account for its top-of-journey influence.
The bottom line
A good ROAS is not a number you read off a benchmark. It is the number that clears your margin, measured with tracking you trust. Published ranges tell you roughly where you should land, but your break-even and your attribution method decide whether your campaign is actually working. Get the tracking right, then judge the number. If you want creator-level ROAS tracked automatically instead of pieced together in a spreadsheet, see how Referwo works for brands.
About the author
Ewen Ling is the co-founder of Referwo and an ecommerce entrepreneur with 16 years of hands-on experience. He co-founded Elinz Electronics in 2005 and scaled it into a fully operational business before managing a successful exit for shareholders in 2021. At Referwo, Ewen helps ecommerce brands build influencer marketing programs that generate measurable revenue, not just reach.